
 English
  Russian
 Crops
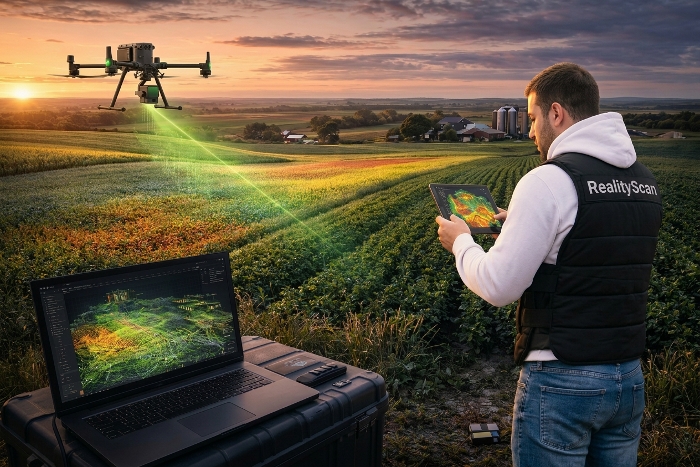
Assessment of plant density, height, canopy density and health; locating moisture and nutrient deficit zones.
Precision agriculture
3D scanning and point clouds to improve farm efficiency: from crops and pastures to livestock facilities.
We generate objective data on crop condition, terrain, livestock and infrastructure for controlled resource management.
Assessment of plant density, height, canopy density and health; locating moisture and nutrient deficit zones.
Biomass calculation, identification of depleted areas, grazing rotation planning.
Animal counts, condition and activity control, movement monitoring.
Optimization of machinery routes, calculation of seed, fertilizer and pesticide volumes.
DSM for irrigation, land reclamation, drainage and erosion prevention.
Early detection of disease, pests, drought and waterlogging.
Yield forecasting from growth dynamics and vegetation indices.
A digital base for subsidies, insurance payouts, certification and environmental audits.
Work is organized seasonally and iteratively: you get not a one-off report, but a managed data-driven decision loop.
Survey plan accounting for crops, terrain, agronomy and livestock tasks.
Aerial and terrestrial scanning, synchronization with weather and soil data.
Point cloud stitching, DSM generation and vegetation maps.
Biomass and health index calculation, stress zone detection.
Yield forecast and generation of prescription maps for machinery.
Archiving results for multi-season analysis and insurance cases.